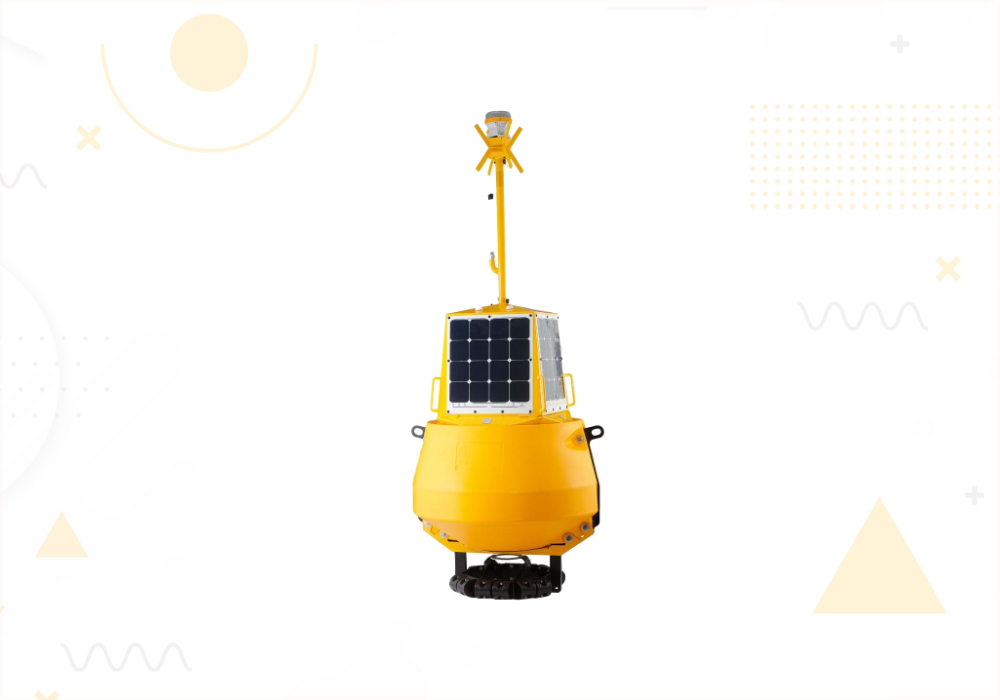
Why should I have Data buoys from Nexsence?
Choice of one Data buoy from nexsence provides the following benefits:
- Versatility: Suitable for small boats and can handle large data volumes.
- Self-driving: Solar panels capture sufficient sunlight for autonomous operation.
- Safe data well: Waterproof container for batteries, data loggers and sensors.
- Easy data collection: Practical walkthroughs for connections and user-friendly data loggers.
- Wireless communication options: Several options, including Wi-Fi and satellite.
- Durable construction: Robust construction ensures long-lasting performance.
These features make it an excellent choice for efficient and reliable data collection in maritime environments.

Data driven marking for your port

Wireless communication
More options, including Wi-Fi and satellite.
Independent-management
Solar panels capture sufficient sunlight for autonomous operation.
Resilient Construction
Robust construction ensures long-lasting performance.
Data sharing
With all the information online, you can easily share the data with those who need it.

FAQ
Related Products
Measuring buoys
Delivering exceptional durability, precision and cost-efficiency in accurate data collection throughout great operational lifetime.

Virtual buoys
Enables the efficient marking of crucial points,, such as maritime channels, construction zones and locations designated for cable installations.
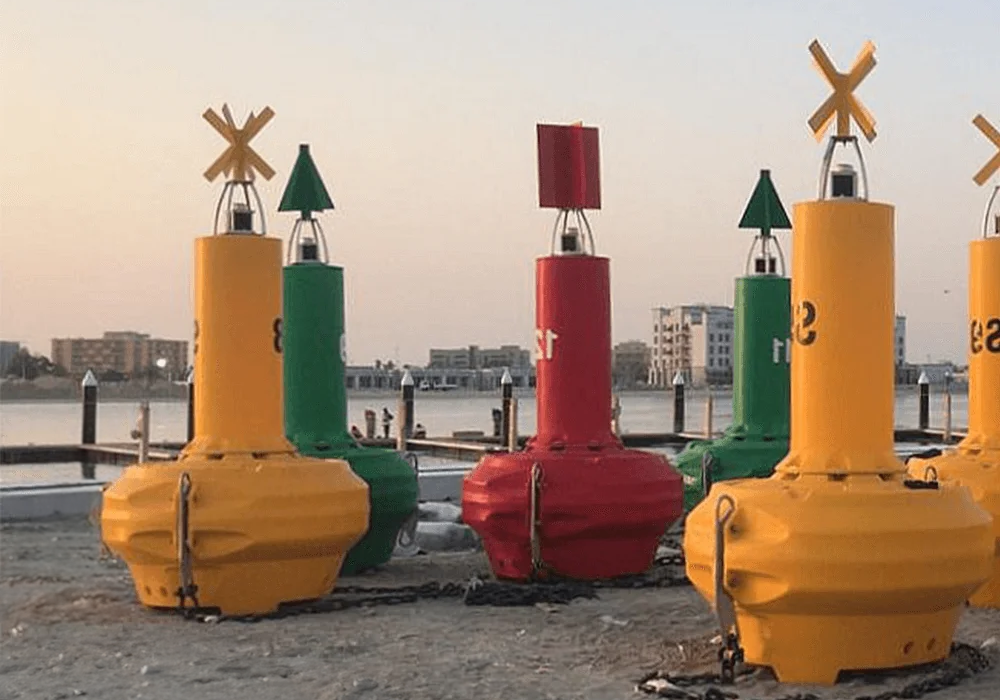
Physical buoys
Environmentally friendly physical buoys that offers excellent hydrostatic stability and visibility.